Thursday, February 07, 2019

Tutorial -- Steps to upgrade Power BI Report Server

This is a tutorial detailing step by step process to upgrade Power BI Report Server to Power BI Report Server January 2019

Before you begin the actual Upgrade you need to take the following backups

  1. Backup your encryption keys
  2. Backup your databases.
  3. Backup config files needed
  4. Backup powerbi files


1 -   So how do you back up the encryption keys:


  • Go to Reporting Services Configuration Manager from the Microsoft Power BI Report Server option as shown below


  • Click on Yes when you are prompted by the below screen.


  • Connect to the PBIRS instance when prompted as shown below


  • Click on the Encryption Keys and Backup button as shown below


  • Choose the file to backup the keys along with the passwords as shown below


2-   Backup your Power BI databases

The next step is to back up the databases -- PBISReportServer and PBISReportServerTempDB:

Follow the below steps to do this
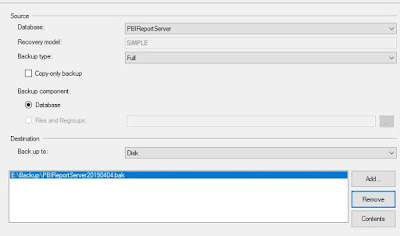

  • Login to SSMS and right click on the PBISReportServer database and choose -- Tasks -- Backup 
  • Add the file name to indicate the location of backup as shown below and click ok


3-   Backup the configuration settings

  • Navigate to the folder (C:\Program Files\Microsoft Power BI Report Server\PBIRS\RSHostingService)  and copy the files named config.json , RSHostingService.exe.config to a backup folder
  • Navigate to the folder C:\Program Files\Microsoft Power BI Report Server\PBIRS\ReportServer and copy the files Rsreportserver.config, Rssvrpolicy.config and Web.config to a backup folder
  • Navigate to the folder C:\Program Files\Microsoft Power BI Report Server\PBIRS\ReportServer\bin and copy the files Reportingservicesservice.exe.config to a backup folder
  • Navigate to the folder C:\Windows\Microsoft.NET\Framework64\v4.0.30319\Config and copy the files Web.config and Machine.config files to a backup folder.  These files are for ASP.NET application


4-   Backup Power BI files from the servers


  • There are many ways to do this.  One of the easiest way is to go the repository and download each file.
  • To do this, navigate to the repository usually if you are doing this on the Power BI Server the location will be something like http://localhost/pbireports 
  • Click on the ellipse of each of the reports.  A small menu opens as shown below.  Click on the download to download the file 


Now the backup process is complete
Now you can begin the upgrade process

UPGRADE Power BI Report Server


  • Download the latest version of the Power BI Report Server available from this link This link consists of 3 files as shown below.  Choose the appropriate files for download.


  • Double click on the PowerBIRS installer and choose Upgrade Power BI Report Server as shown below

  • The installer prompts with User Access dialog as shown below.  Click Yes

  • The installer comes up with the security and privacy declaration.  Tick the I Agree checkbox and click Upgrade as shown below.

  • The installer begins to upgrade existing files and installs the necessary files as shown below

  • After the upgrade process is complete, the following screen shows up.

  • Click on the Configure Report Server from the above screen
  • The next step is to restore the encryption keys that you have backedup.
  • To do this click on the Encryption Keys and Restore button as shown below

  • Choose the saved backup file from the screen below and click OK

  • After the keys are restored you get the below result

  • Next click on the PBIDesktop.exe installer and install the Power BI Desktop for Report Server.  This is report authoring tool for building power bi files that you can publish on to the report server. 
  • Next step is to restart the server to complete the process.
  • So now you can navigate to the PowerBI repository location and access your Power BI files.

  • If you have any issues accessing the data from the existing files on the power bi report server interface, try to open the file in the new Power BI Desktop for RS and republish the report to the server. 


Thursday, January 10, 2019

Create a New Partition on existing multi-dimensional SSAS cube.

Below is a process that I follow every year to create a partition in existing multi-dimensional SSAS cubes that I maintain.


  • Log in to the SQL Server Analysis Services server using SQL server Management Studio as shown below.


  • Expand the Databases by clicking on the + sign.  Choose the database you want to create the partition for.  
  • Expand the Cubes  and expand the Cube that you want to partition. Expand the MeasureGroup and expand the Measure Groups – You can see the Partitions folder there.  Expand the Partitions folder to see the existing partitions as shown below.


  • Right Click on the Partitions folder and click on New Partition as shown below:


  • Partitions wizard opens as shown below.  Click on Next


  • Choose the MeasureGroup and table as shown below.  You must choose at least one table to proceed further. 


  • Click Next


  • You need to restrict rows in this partition by providing a query.  Tick the specify a query to restrict rows in the below screen.  


  • Make sure your query selects rows that are included only in this partition.  I usually use the where condition that selects data in a year.  
  • For example select * from [dbo].[cubeExample]  WHERE LEFT([DateKey],4) = '2019'  This query gives data only for 2019.


Click on Check after providing the query to validate the syntax as shown below.


  • If the Syntax check was successful, you will get a success message as shown below.


  • If the Syntax Check was not successful, it gives an error.  An example error is shown below.


  • Fix the error and recheck the Syntax.  Click Next.  you may be asked for  a UserName and Password as shown below.


  • Choose Your Processing Location and Storage Location as shown below and click Next


  • Choose the Name of the partition on the Next screen and also the Aggregation options as shown below and then click Finish


Tips that I learnt:

  1. Ensure that you take a backup of the Cube database before creating the partition.
  2. Ensure that you have the permissions to create the Partitions.  Also ensure that the username you use is a generic username and not your own username 
  3. Ensure that you have a look at the query for the previous partitions.  Best approach is to copy the query for the partition for the previous year and use that as a starting point.

Tuesday, January 08, 2019

Power BI Did you know - Series 2 (Add Refresh Date )

Did you know that you can add a refresh date to indicate when your data has been last refreshed ?

Below are the steps to do this.


  • Open the report in Power BI Desktop
  • Go to Edit Queries from the Home ribbon as shown below


  • From the Power Query editor, choose the table where you would like to add the refresh date and click on Advance Editor as shown below

  • Add the below code before the in statement 
 #"Added Refresh Date" = Table.AddColumn(#"Renamed Columns", "Refresh Date", each DateTimeZone.FixedUtcNow(), type datetimezone)

  • Replace "Renamed Columns" from the above code to the name that is mentioned just above the line as shown below


For example if the below code is in the Advanced Editor, the "Removed Columns" in the step need to replace the "Renamed Columns" as shown below

let
    Source = Sql.Databases("localhost"),
    table1 = Source{[Name="table1"]}[Data],
    dbo_table = table1 {[Schema="dbo",Item="table"]}[Data],
    #"Removed Columns" = Table.RemoveColumns(dbo_table,{"col2", "col4", "col6"}),
    #"Added Refresh Date" = Table.AddColumn(#"Removed Columns", "Refresh Date", each DateTimeZone.FixedUtcNow(), type datetimezone)
in
    #"Added Refresh Date"


  • This will create a new column named Refresh Date in the table.
  • Close and Apply changes.


  • Now create a new measure, in order to add the last refresh date to the report 
  • An example code for the new measure could be as below


Footer = CONCATENATE("Last Refreshed " , MAX(Schedule[Refresh Date]))

Use a card visual to display the measure as shown below


There you go, you have the last refreshed date in your report

Wednesday, December 05, 2018

Power BI Did You Know -- Series 1 (Contact Us button)

Did you know that you can add a contact us button in your Power BI reports ?

Here is how you add a contact us button in your power bi report.

Step 1:  Go to your Power BI report
Step 2:  Add a text box

Step 3:  Type in * as shown below: (1)


Step 4:  Change the font of the * to Windings as shown below:(2)  This will convert the * to an envelope


Step 5: Now add a mailto link to the envelope button as shown (3)


Step 6:  You can test this in Power BI Desktop by using CTRL+Click. This will open a new email with the default account. When you publish to the Power BI service, you can click on the envelope to open a new email with the default account as shown below:


Got this tip from Charles Sterling Microsoft Power BI Program Manager.

You can use the  decoder link to translate between normal font and Windings font and add hyperlinks to the same by using the DECRYPT button on the decoder link.  For example you can use '(' to add a phone button.

Similarly you can use the ENCRYPT button on the decoder link to find out what symbol each of the Alphabets and numbers represent in Windings font.


Tuesday, October 09, 2018

Power BI Competition for Kids aged between 11 and 15

Yesterday I have concluded the 12 weeks databases and data visualisation classes by running a #powerbi data visualisation competition for kids.  

Extremely happy that Reza Rad and leila Etaati have agreed to be the judges for this first ever #powerbinz competition.  
11 kids participated and I have given them the links to makeovermonday website to choose their own data and come up with their visualisations.

I sincerely thank all the kids and parents Bindu HandaSurya AtmalaSreesutha NampallyRajnish Suri, PMP and  all others who are not there on LinkedIn for all their extended support without which the event would not have been successful.  Now I feel that the kids have learnt something useful over the last 12 weeks. :)  

Below are the photos of the top 3 winners of the competition. If anyone is interested in watching the videos of the kids presentations you can access the below link  https://drive.google.com/open?id=185DKP5DxBl0Lfb9rxPcxmdKAPbhMHJHD 


Wednesday, September 26, 2018

Free Databases and Data Visualisations course for kids Week 8 to 11

It has been quite a while since I have posted about the free databases and data visualisation classes for 11 to 15 year old kids.  So here I am with an update.  For the last 3 weeks, I have taught basics of importing data from the Web using the URL and using a csv or a excel file.  Also gave an overview of the 3 views in Power BI Desktop, query editor, Applied steps pane, removing columns etc.

I have also covered about new columns and measures  what the main difference is between those 2. Also covered very basic DAX functions, explained about the date dimension, Bookmarks and drillthoughs.

Next week I have asked everyone to pick a dataset on their own and come up with their data visualisations.  So waiting for their creativity to unveil.

Also wanted to thank @Reza and @Leila from #Radacad for sponsoring biscuits for kids.  They have been enjoying them for the last 3 classes.


Monday, September 03, 2018

Some more happy moments of SQL Saturday Auckland 2018

I got a few of the kids whom I teach Databases and Data Visualisations to attend this event.  In fact I was trying to avoid them coming but they forced themselves to come to this event as they were very enthusiatic in attending this event.  They have attended 4 sessions where I thought they could understand what the speakers were saying.

Here are a few snapshots of the kids with the speakers.


SQL Saturday Auckland 2018 Presentation

On 1st September 2018, I had a wonderful opportunity presenting at the SQL Saturday Auckland event at UNITEC. The title of my session was Google Forms Meets Power BI via SSRS 

You can download my presentation here

It was a Full house session and lot of questions by the participants.  Thoroughly enjoyed sharing my knowledge.

I also enjoyed helping for this event organised by @Rad_Reza and @Leila_Etati.
Many thanks for this wonderful opportunity.


Tuesday, August 21, 2018

Free Databases and Data Visualisations course for kids Week 7

Yesterday I gave the results for the database fundamentals test that was conducted last Monday. If anyone wants to try the test you can click here
 #microsoftnz, #sqlserver,  #sqlfamily

I started off the class with an introduction to Data Visualisation.  Why we need data visualisations and type of data visualisations.  Also covered different tools for data visualisations. Finally I introduced what Power BI Desktop is. hashtag#powerbi, hashtag#powerbiusergroup.

Had an interactive session with a lot of questions from the kids like 'What is a Heat Map ?' 'What is the difference between pictorial and graphical presentation' etc.

Shared a movies csv file and introduced the Get Data button in Power BI Desktop and got all of them to download the movies database.  Explained how to create the main visuals -- the column chart and stacked bar charts.  What kind of columns can be used in the Values part of the visuals.
Gave them homework to create their own visuals and present them in the next class.
I have also asked them to download the country latitude and longitude dataset that is available here
https://lnkd.in/gN72ccD by using the Get Data -- web button with a view to teach them about Maps in the next class.

I am looking forward for their creations next week.


Tuesday, August 14, 2018

Free Databases and Data Visualisations course for kids Week 6

Week 6 update:

Yesterday the class was a bit different because it started off with a Database Fundamentals test.  There were 20 questions to answer that covered all the database concepts that were covered in the last 5 weeks.  If you would like to answer the questions yourself, the questionsare here. #microsoftnz,#sqlserver, #sqlfamily

15 kids and 2 adults took part in the test. I have marked the answers and am very pleased with the results which are as below:
 2 of the kids acheived 100 %
 4 kids achieved between 90% and 100%
 3 kids between 70% and 80%
 3 kids between 55% and 65%
 3 kids achieved 45 %.  These are the kids who joined after 3 weeks and they did not have sql server to practice at home as they had MAC and Chrome books as their devices.

After the test we discussed the answers for the questions.  Then I covered the topic on Table joins.  Below is a photo of the kids smiling after the test.

From next week I will be teaching them Data Visualisation using Power BI #powerbi, #powerbiusergroup.  I will be designing the course with the help of @reza rad book power-bi-from-rookie-to-rockstar  and @marco russo and @alberto ferrari's book- Introducing Microsoft Power BI .

Any help in designing the course with kids in mind is highly appreciated.


Tuesday, August 07, 2018

Free Databases and Data Visualisations course for kids Week 5

Week 5 update:

It was another full house yesterday with 17 kids and 4 parents attending the course. #sqlfamily #microsoftnz 

The first 20 minutes were spent in solving issues with questions like --
- 'I created a table but I cannot see it'
- 'I am getting a syntax error'

After this, when I did the recap of what happened last week, I was pleased to see most of the kids eagerly answering my questions regarding update and delete statements. They were keen to discuss some of the SQL functions I covered  There was a bit of difficulty in understanding the substring function. But finally everyone understood this function.

One of them wrote a substring function by passing her name as the first argument instead of the field name and tried to return a substring of her name which was quite impressive.


Wednesday, August 01, 2018

Free Databases and Data Visualisations course for kids Week 4

Databases and Data Visualisations course for kids aged between 11 to 15 years week 4 update. It was another full house on Monday with 16 kids and 4 parents attending the course. #sqlfamily #microsoftnz  This time a uni student Sakshi came to help.

The first 45 minutes were spent in solving issues with questions like --
- 'I created a table but I cannot see it'
- 'Why is my insert statement not working ?'
- 'I have inserted a lot of duplicate records.  How do I delete them ?'
- 'I am getting a syntax error'

After this, when I did the recap of what happened last week, I was pleased to see most of the kids eagerly answering my questions. I felt that now all the kids are able to genuinely understand what I am trying to teach them.

The agenda for this week was to explain the update and delete statements.  The Like and In operators in the where clause.  Some of the basic SQL functions like Min, Max, Count, AVG, SUM.  String functions like Left, Right and Substring.

It is interesting to see how some of the kids think.  One of them asked what if we accidentally deleted all records ?  Then I covered the Begin Transaction, rollback and commit features which I didn't even plan to cover as I thought that will be deeper and difficult for them to understand.

As usual I felt very happy to see the enthusiasm in these kids. I am looking forward for the session on next Monday.


Tuesday, July 24, 2018

Free Databases and Data Visualisations course for kids Week 3

Databases and Data Visualisations course for kids aged between 11 to 15 years week 3 update. It was a full house yesterday with 15 kids and 5 parents attending the course. #sqlfamily #microsoftnz

During my recap of what happened last week, two of the kids wanted to answer all of my questions.  For the homework that I have given, I could see kids create databases named 'mytrips', 'moviesworld', 'personalitytraits', 'eventmanagement', 'Hobbies' etc.

There were only 2 challenges faced by the kids when they were doing their home work.  First was when they had a space in the database or table name. Second was the table was not created in the new database they created.

The agenda for week 3 was to show them how to insert data into the tables and view the data.  I could just cover select statement and basic where clause and the time was up.

I feel very happy to see the enthusiasm in these kids. I am looking forward for the session on next Monday.


Tuesday, July 17, 2018

Databases and Data Visualisations course for kids Week 2

Databases and Data Visualisations course for kids aged between 11 to 15 years week 2 update. It was good to see so many responses for my last weeks post. #sqlfamily #microsoftnz It was good to see all the kids come back to hear all about databases for the 2nd week.   So first I started off with a Recap of last week, to help the 3 new kids understand the database concepts and also to test the knowledge that they have gained. It was good to see that they remembered most of the concepts except for the redundancy part. The agenda for week 2 was to show them how they could access SSMS and create a database and a table. Everyone of them had hands on experience creating a database named school and a table named student. I also wanted to cover how to insert data in this week but ran out of time so will do that next week. In the end as promised last week, I covered Excel tips as below. - Select All with One click - Open multiple excel files at a time - Move within an excel sheet (Ctrl +Home, Ctrl+End, Ctrl + arrow keys, Ctrl+Shift+Arrow Keys, - Move between different sheets (Ctrl + Tab) I have also given them some homework to ensure that they practice what was learnt in the past 2 sessions. I am looking forward for the session on next Monday.


Tuesday, July 10, 2018

Databases and Data Visualisations Course for kids Week 1

As mentioned last week, I have started the Databases and Data Visualisations course for kids aged between 11 to 15 years yesterday.

It was a very good and fun experience teaching these kids about database concepts.  I asked each one of them what a database means to them.  Everyone had a good basic understanding of what a database meant before I showed them what it meant.  The one response that I liked from one of them was "A database is a base where you store data"

To explain about Relational Databases and Normalisation, I have asked each one of them to type in some information about their studentids names, classes, teachers and schools.

This activity proved to be useful to make them understand the concept of redundany and the disadvantages that arise out of it.  Then it was easy for me to explain about Normalisation.

I have given them home work of installing SQL Server Express on their laptops.

Since I have used Excel for their activity there arose a need for them to know more about Excel.  So I will be doing a 15 - 20 min session on Excel every week basically giving them some Excel tips.

I am looking forward for the session of Creating databases and tables using SQL Server next Monday.


Thursday, July 05, 2018

Teaching kids about databases

Every year I try to teach kids some aspects of Technology. Last year I taught Game Development using Construct 2 for a group of 12 primary and intermediate school kids. They developed 9 games and participated at a competition that involved High School kids. Two of the games got 2nd and 3rd prizes as well.
In this process I really enjoyed teaching the basics and the kids also enjoyed making the games that they liked and learned a lot.
So I was thinking of what to teach them and came up with a lot of ideas and finally settled with -- why not teach them with what I hae been doing for the last 15 years ? 
And so I came up with the course title 'Database Programming and Data Visualisations' For this I will be using the latest SQL Server Express and Power BI as the database and data visualisation tools. I have planned this to do in a span of 8 - 10 weeks.
Below is the list of topics I am going to cover for this free course.
  • Introduction to databases
  • Create an SQL database along with some tables 
  • Insert Update and Delete data 
  • Importing data
  • Querying the data using DDL statements
  • Introduction to Data Visualisation
  • Introduction to Power BI 
  • DAX basics 
  • Create Visualisations 
  • Usage of bookmarks and drillthroughs
  • Create and share dashboards based on reports in Power BI desktop
  • Using custom visuals
  • Optimise the model for Natural Language Query
I would like to make it as fun and interesting as Hamish Watsonpossible. So I look to you all for ideas to help me deliver this successfully so that they can get the fundamentals fo database basics, normalisation, relational databases and visualisation concepts right.
#sqlfamily, #powerbi, #microsoftnz
So please bring along all your creative ideas that can help me deliver this program successfully.

Power BI Kids competition 2026

 Celebrating the next generation of data rockstars! 🚀✨ I am incredibly proud to share that we have officially wrapped up our 8-week #PowerB...