Databases and Data Visualisations course for kids aged between 11 to 15 years week 3 update. It was a full house yesterday with 15 kids and 5 parents attending the course. #sqlfamily #microsoftnz
During my recap of what happened last week, two of the kids wanted to answer all of my questions. For the homework that I have given, I could see kids create databases named 'mytrips', 'moviesworld', 'personalitytraits', 'eventmanagement', 'Hobbies' etc.
There were only 2 challenges faced by the kids when they were doing their home work. First was when they had a space in the database or table name. Second was the table was not created in the new database they created.
The agenda for week 3 was to show them how to insert data into the tables and view the data. I could just cover select statement and basic where clause and the time was up.
I feel very happy to see the enthusiasm in these kids. I am looking forward for the session on next Monday.
Tuesday, July 24, 2018
Tuesday, July 17, 2018
Databases and Data Visualisations course for kids Week 2
Databases and Data Visualisations course for kids aged between 11 to 15 years week 2 update. It was good to see so many responses for my last weeks post. #sqlfamily #microsoftnz
It was good to see all the kids come back to hear all about databases for the 2nd week.
So first I started off with a Recap of last week, to help the 3 new kids understand the database concepts and also to test the knowledge that they have gained. It was good to see that they remembered most of the concepts except for the redundancy part.
The agenda for week 2 was to show them how they could access SSMS and create a database and a table. Everyone of them had hands on experience creating a database named school and a table named student.
I also wanted to cover how to insert data in this week but ran out of time so will do that next week.
In the end as promised last week, I covered Excel tips as below.
- Select All with One click
- Open multiple excel files at a time
- Move within an excel sheet (Ctrl +Home, Ctrl+End, Ctrl + arrow keys, Ctrl+Shift+Arrow Keys,
- Move between different sheets (Ctrl + Tab)
I have also given them some homework to ensure that they practice what was learnt in the past 2 sessions.
I am looking forward for the session on next Monday.
Tuesday, July 10, 2018
Databases and Data Visualisations Course for kids Week 1
As mentioned last week, I have started the Databases and Data Visualisations course for kids aged between 11 to 15 years yesterday.
It was a very good and fun experience teaching these kids about database concepts. I asked each one of them what a database means to them. Everyone had a good basic understanding of what a database meant before I showed them what it meant. The one response that I liked from one of them was "A database is a base where you store data"
To explain about Relational Databases and Normalisation, I have asked each one of them to type in some information about their studentids names, classes, teachers and schools.
This activity proved to be useful to make them understand the concept of redundany and the disadvantages that arise out of it. Then it was easy for me to explain about Normalisation.
I have given them home work of installing SQL Server Express on their laptops.
Since I have used Excel for their activity there arose a need for them to know more about Excel. So I will be doing a 15 - 20 min session on Excel every week basically giving them some Excel tips.
I am looking forward for the session of Creating databases and tables using SQL Server next Monday.
It was a very good and fun experience teaching these kids about database concepts. I asked each one of them what a database means to them. Everyone had a good basic understanding of what a database meant before I showed them what it meant. The one response that I liked from one of them was "A database is a base where you store data"
To explain about Relational Databases and Normalisation, I have asked each one of them to type in some information about their studentids names, classes, teachers and schools.
This activity proved to be useful to make them understand the concept of redundany and the disadvantages that arise out of it. Then it was easy for me to explain about Normalisation.
I have given them home work of installing SQL Server Express on their laptops.
Since I have used Excel for their activity there arose a need for them to know more about Excel. So I will be doing a 15 - 20 min session on Excel every week basically giving them some Excel tips.
I am looking forward for the session of Creating databases and tables using SQL Server next Monday.
Thursday, July 05, 2018
Teaching kids about databases
Every year I try to teach kids some aspects of Technology. Last year I taught Game Development using Construct 2 for a group of 12 primary and intermediate school kids. They developed 9 games and participated at a competition that involved High School kids. Two of the games got 2nd and 3rd prizes as well.
In this process I really enjoyed teaching the basics and the kids also enjoyed making the games that they liked and learned a lot.
So I was thinking of what to teach them and came up with a lot of ideas and finally settled with -- why not teach them with what I hae been doing for the last 15 years ?
And so I came up with the course title 'Database Programming and Data Visualisations' For this I will be using the latest SQL Server Express and Power BI as the database and data visualisation tools. I have planned this to do in a span of 8 - 10 weeks.
Below is the list of topics I am going to cover for this free course.
- Introduction to databases
- Create an SQL database along with some tables
- Insert Update and Delete data
- Importing data
- Querying the data using DDL statements
- Introduction to Data Visualisation
- Introduction to Power BI
- DAX basics
- Create Visualisations
- Usage of bookmarks and drillthroughs
- Create and share dashboards based on reports in Power BI desktop
- Using custom visuals
- Optimise the model for Natural Language Query
I would like to make it as fun and interesting as Hamish Watsonpossible. So I look to you all for ideas to help me deliver this successfully so that they can get the fundamentals fo database basics, normalisation, relational databases and visualisation concepts right.
#sqlfamily, #powerbi, #microsoftnz
So please bring along all your creative ideas that can help me deliver this program successfully.
Thursday, June 07, 2018
Migrating Sql Server Analysis Services (SSAS) Cubes from SSAS 2014 to SSAS 2017
I have finally migrated our multidimensional cubes from SSAS
2014 to SSAS 2017
Below are the steps that I have followed to achieve this.
- On a new Virtual Machine (VM!) I have installed SQL SERVER ANALYSIS SERVICES 2017. This is our main cube storage Virtual Machine
- On the Reporting Services Virtual Machine (VM2) I have installed another instance of SQL SERVER ANALYSIS SERVICES 2017 with the aim of synchronizing the cubes between VM1 and VM2. VM2 is being used for reporting jobs so that there is no load on the main VM! While processing of cubes.
- In order to migrate the cubes from SSAS 2014 to SSAS 2017, I have logged into SSAS 2014 machine and scripted out all the databases using the Script Database as – Create To Option as shown below.
- Then I logged into VM1 and created the databases by running the scripts that I generated in the above step.
- The next step was to ensure that the data sources and credentials are correct.
- To do this expand the Datasources of each of the databases and right click on the datasources and click on Properties as shown below.
- Click on the Connection string and make sure you have the correct login details as shown below
If the processing of the cube is successful then the agent jobs that process the cubes will also be successful.
Security issues that you
need to take care of are as follows:
- Right click on the SSAS server instance and click on properties as shown below.
- Add the user that will be running the agent job of processing the cube.
- Ensure that the SSAS Service runs under that user and not NTService\MSSqlserverOLAPService
- After ensuring the above security in place most of the jobs were successful except for the synchronizing job that synchronises the databases from VM1 and VM2. When the synchronizing jobd runs this gave an error as below
Executed as user: NT
Service\SQLSERVERAGENT. Microsoft.AnalysisServices.Xmla.XmlaException: Errors
in the OLE DB provider. The server returned the following error: (Either
the user does not have permission to
synchronize objects on the source or target instance,
To resolve the error above ensure the following steps are
taken care of
The user must have permissions for the below services as shown below
If you have any issues in migrating Analysis Services Databases, feel free to contact me.
The user must have permissions for the below services as shown below
- Log on as a service
- Replace a process-level token
- Bypass traverse checking
- Adjust memory quotas for a process
If you have any issues in migrating Analysis Services Databases, feel free to contact me.
Saturday, May 26, 2018
My Presentation for SQL Saturday South Island 2018
Today I thoroughly enjoyed presenting on the topic "Google Forms Meets Power BI via SSRS"
The aim of this session was to provide an end to end solution for creating and sending feedback forms and analysing the same using Power BI.
The slides can be downloaded from this link below.
http://www.sqlsaturday.com/712/Sessions/Details.aspx?sid=80613
The aim of this session was to provide an end to end solution for creating and sending feedback forms and analysing the same using Power BI.
The slides can be downloaded from this link below.
http://www.sqlsaturday.com/712/Sessions/Details.aspx?sid=80613
Tuesday, April 03, 2018
Extracting Power BI Usage Statistics from Power BI Report Server
Today I had a thought of monitoring the usage of Power BI Reports.
So I started exploring the PowerBIReportServer database and see whether there are any statistics that I could utilise. The database had views of executionlogs that are similar to the SSRS ReportServer database. After studying all the available views, I came up with this stored procedure to monitor the usage of the Power BI Reports.
USE PBIReportServer Go SET ANSI_NULLS ON GO SET QUOTED_IDENTIFIER ON GO Create PROCEDURE [dbo].[PBI_Usage_Stats] AS BEGIN SELECT [InstanceName] ,[ReportPath] ,[UserName] ,[TimeStart] ,[TimeEnd] ,[TimeDataRetrieval] ,[TimeProcessing] ,[TimeRendering] ,[Source] ,[Status] ,[ByteCount] FROM [PBIReportServer].[dbo].[ExecutionLog2] where Status = 'rsSuccess' and ReportPath != 'Unknown' and Bytecount > 0 and username not like 'NT SERVICE%' End
Monday, March 26, 2018
Highlights from tonight’s meetup with Phil Seamark
I wanted to summarise some of the highlights here –
- Generate data using the randbetween function
- Generate a date table using calendar function -- More information can be found on the blog post here
- Generate a sales table with fictitious data again using the RANDBetween , generate, addcolumns, filter, rand etc functions.
- Create a summary table using the summarisecolumns function. He also explained the advantages of the summary table.
- He also discussed when to use a calculated column and calculated measure. Demonstrated the differences between the two very clearly. More information can be found on a blog post from Reza here
- Next he introduced the DAX Studio. This is a great tool that can be used in conjunction with Excel and Power BI. There are many advantages of using the DAX Studio. Some of them are Viewing your open Power BI data model, Formatting your DAX code, use the DMVs to analyse the performance. You can also look at the Query Plans and server timings.
- Next he showed how you can use SQL Server Management Studio to open the Power BI desktop model by connecting to the Analysis services Database that the Power BI Desktop dynamically creates. You can browse through the Tabular model of the database using the Sql Server Management Studio.
Some great questions were also asked after the presentation
like
- What is the difference between Summarise and summarisecolumn function.
- Can we export the Power BI Desktop model and create SSAS model using Sql Sever Management Studio.
- What do you think of the Common Data Services ?
And a few more…
I definitely learned a lot in this session.
Wednesday, March 21, 2018
Migrating to Power BI Report Server – March 2018 from Power BI Report Server – October 2018
Last night, I
found out that the Power BI Report
Server – March 2018 update is available for download. So I was very excited to install this and use
it for a brand new Power BI report that I was doing.
Again, this has
two steps in the migration process as outlined in my previous article of Migrating SSRS
2014 to SSRs 2017.
- The first step is to Install the new release of Power BI Report Server on a different machine.
- The second step is to migrate the existing Power BI reports into the new installation.
So here you go
– with a run down of the steps that I have followed to migrate. I did not do an in place upgrade.
Step 1
Installing Power
BI Report Server – March 2018
Downloaded the
new Power BI Report server from the below link
When you click
on the Download button – you will be prompted to choose the files as shown
below. Choose the relevant files and
click next
When the
download is completed, run the installer file named PowerBIReportServer.exe
Here are some
screenshots from my installation.
Choose Developer from the below screen.
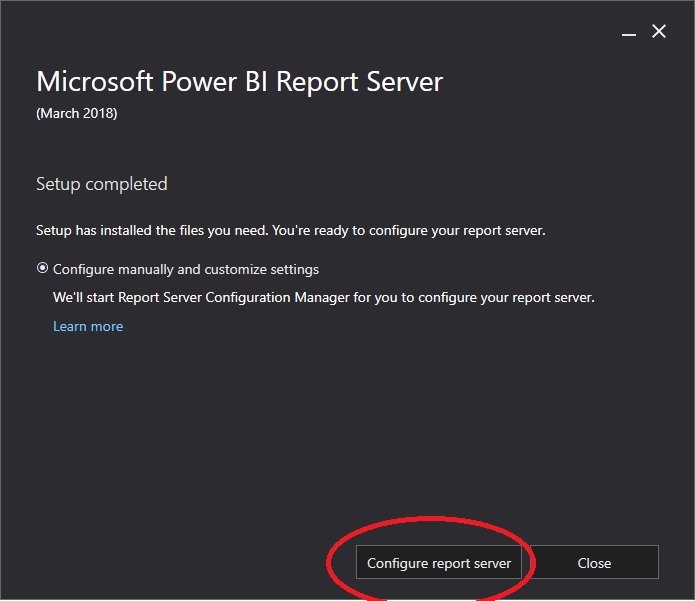
Click on the Configure Report Server on the below screen to configure Power Bi Report Server.
When the
Reporting Services Configuration launches, make sure you choose the correct
instance.
My installation
Is showing two instances in the dropdown because I also have a SSRS
installation on this server.
I choose the
PBIRS as I am configuring the Power BI Report Server.
Service Account
Tab - Just use the default
Web Service URL
Tab --
Make sure you are changing the default ReportServer virtual directory to PBIReportServer and clcik Apply
Database Tab -- On the Database -- click on change Database and create New Database
In the below screen ensure that the ReportServer is changed to PBIReportServer. Then the tempdatabase will automatically change to PBIReportServerTemp database.
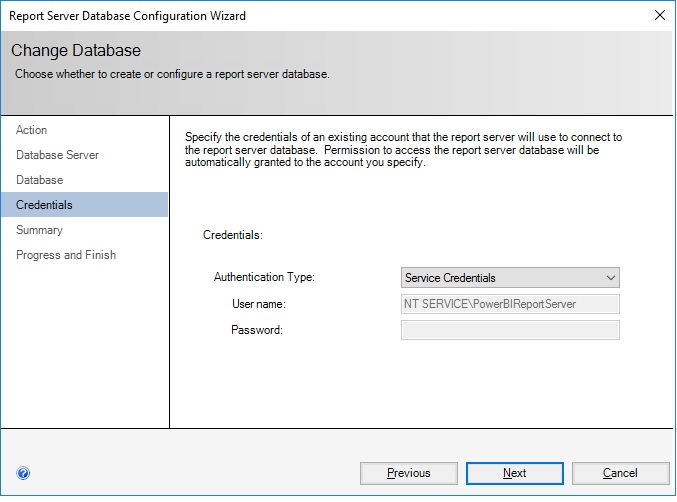
Under Credentials -- Leave the Authentication Type to Service Credentials a shown below.
Then Click Apply
Web Portal URL
Tab -- Under this ensure that the virtual directory is changed to PBIReports from Reports and then click Apply
I did not
change any other tabs. Click Exit from
Report Server Configuration Manager
Step 2
Migrate the existing Power BI reports
into the new installation of Power BI Report Server March 2018
The next step is to migrate
the existing Power BI reports into the new installation. To do this, follow the below steps.
- 1Back up the PBIReportServer and PBIReportServerTemp databases from the old Power BI Report Server October 2017 Services installation.
- 2.Restore these two databases on to the new Power BI Report Server installation.
Now you will find the reports from the old SSRS server in
the new SSRS server if you browse through the url http://localhost/pbireports on the new Power
BI Installation box as shown below.
The next important step is to use the new PowerBIDesktopforRS executable to author the Power BI Reports to publish to this new Power BI Report Server Installation.
Tuesday, March 06, 2018
My experience with migrating SSRS reports from SSRS 2014 to SSRS 2017
In this post I
would like to share my experience of migrating our Reporting server from sql
server We installed SQL SERVER 2017 on a new VM. Now I wanted to migrate our SSRS reports to
this server.
There are two
steps involved to migrate SQL Server Reporting Services to SSRS 2017.
- · The first step is to Install the SQL Services Reporting Services application.
- · The second step is to migrate the existing reports into the new installation.
Step 1
Installation of SQL Server Reporting
Services 2017
In SQL Server
2017, it is available as a separate menu item on the Installation Tab of the SQL
Server 2017 Installation center as shown below.
When you click
on this, it takes you to the download page of SQL Server Reporting Services as
shown below.
This is because now because
of the integration between Power BI Report Server and the Reporting Services
there is a separate installer.
Click on the
Download button.
I have posted
some screenshots below.
Choose Developer in the below screen.
Choose Configure Report Server in the below screen.
This will open the Reporting Services Configuration Manager as shown below:
I have not made any changes to the Service Account tab.
On the Web Service URL Tab - I have just clicked apply to get the recommended suggestions updated.
On the Database Tab -- I have clicked on the Change Database button -- Opted for Creating a new database named (ReportServer) and clicked on apply. This created two new databases named ReportServer and ReportServerTemp.
On the Web Portal URL Tab -- I have clicked Apply so that the default settings are applied.
I did not make any other changes and clicked Exit.
Now, I tried to connect to the browser url http://localhost/reportserver , then
the following error appeared.
To get rid of this
error, I followed the below steps.
- Bring up SQL Server 2017 Configuration Manager .
- Click the dropdown arrow in
front of “SQL Server Network Configuration”, and click the “Protocols for
MSSQLSERVER”. (If you are using a named SQL Server instance, please select
the named instance instead.)
- Make sure both the “TCP/IP” and
“Named Pipes” protocols are enabled. If they are disabled, enable them by
clicking on the dropdown as shown
Then I got an
access denied error.
The report server cannot open a connection to the report server database. The log on failed. (rsReportServerDatabaseLogonFailed) Get Online Help Cannot open database "ReportServer" requested by the login. The login failed. Login failed for user
To get rid of this,
I followed the below steps
- Bring up the SQL Server Reporting Services
Configuration Manager,
- Click the "Database" tab and click change credential as shown below.
- Make sure the “Current User-Integrated
Security” is selected and click Next.
- Ensure that the “Authentication
Type” is set to “Service Credential”. This will use the user that the
Reporting Services running under to connect to the report server database
as shown below.
- Click Next and Next to apply.
Now I was able to access the ssrs site http://localhost/reportserver
Step 2
Migrate the existing reports into the
new installation of SQL Server Reporting Services 2017
The next step is to migrate
the existing reports into the new installation.
To do this, follow the below steps.
- 1. Back up the ReportServer and ReportServerTemp databases from the old Reporting Services installation.
- 2. Restore these two database on to the new SSRS installation database.
Now you will find the reports from the old SSRS server in
the new SSRS server if you browse through the url http://localhost/reports on the new ssrs
installation box.
So I tried running a report, but I encountered the below
error.
- The report server was unable to validate the integrity
of encrypted data in the database. (rsCannotValidateEncryptedData)
When you restore the ReportServer from a back up, it also
restores the encryption keys. So in
order to resolve this error, I had to delete the encryption keys and regenerate
them. To do this go to Reporting
Services Configuration Manager and click on Encryption Key tab and click on the
delete button and Apply as shown below.
After getting this done, the report execution was
successful.
However, when I looked at the Subscriptions of each report,
they were not transferred. So I will be
migrating the subscriptions later and I will post my experience.
To be continued…………..
Subscribe to:
Posts (Atom)
Power BI Kids competition 2026
Celebrating the next generation of data rockstars! 🚀✨ I am incredibly proud to share that we have officially wrapped up our 8-week #PowerB...
-
40 spectacular paper designs (using amazing colors & concepts) that need to look good and be informative in order to focus users’ attent...
-
From the past 3 days I have been working on resolving merged and hidden cells issues when an SSRS reports is exported to excel. ...
-
Challenge : Yesterday I was trying to download a parquet file from the Microsoft Lakehouse on to my laptop. So I was searching for the do...