Friday, December 06, 2024

Unleashing Data Democracy: How Microsoft Fabric Powers a Data Mesh Architecture


The traditional centralized data lake or warehouse often struggles to keep pace with the growing complexity and volume of modern data. Enter the data mesh, a decentralized architectural approach that empowers domain-specific teams to own and manage their data as products. Microsoft Fabric, with its unified platform and robust capabilities, is perfectly positioned to support and enable this transformative approach.

What is a Data Mesh?

A data mesh is a decentralized socio-technical approach to data management. It shifts the focus from centralized data ownership to distributed ownership by domain-specific teams. Key principles include:

  • Domain Ownership: Domains own their data as products, with clear interfaces and service-level agreements.
  • Data as a Product: Data is treated as a product, with discoverability, addressability, trustworthiness, and security.
  • Self-Serve Data Infrastructure as a Platform: A platform provides the necessary infrastructure for domains to manage their data independently.
  • Federated Computational Governance: Decentralized governance with standardized global policies.

How Microsoft Fabric Enables a Data Mesh:

Fabric's unified platform seamlessly aligns with the data mesh principles:

  • OneLake as a Decentralized Data Lake: OneLake provides a single, logical data lake across the entire organization, enabling domain-specific data zones while maintaining global accessibility. This supports domain ownership and data as a product.
  • Workspaces for Domain Ownership: Fabric workspaces allow domains to manage their data products independently, controlling access, security, and lifecycle.
  • Data Products with Lakehouses and Data Warehouses: Domains can build data products using Lakehouses (for diverse data types) or Data Warehouses (for structured analytics), tailored to their specific needs.
  • Data Flows and Pipelines for Self-Serve Data Infrastructure: Fabric's data integration tools enable domains to build and manage their own data pipelines, promoting self-service.
  • Microsoft Purview Integration for Federated Governance: Purview provides a centralized governance layer, enabling data discovery, lineage tracking, and policy enforcement across the data mesh.

Benefits of a Data Mesh with Microsoft Fabric:

  • Increased Agility and Speed: Domains can independently manage their data, reducing dependencies and accelerating time-to-insight.
  • Improved Data Quality and Relevance: Domain experts, who understand their data best, are responsible for its quality and accuracy.
  • Enhanced Innovation and Experimentation: Domains can easily explore and experiment with their data, fostering innovation.
  • Scalability and Flexibility: The decentralized architecture allows the data mesh to scale easily and adapt to changing business needs.
  • Reduced Data Silos: OneLake and Purview promote data sharing and collaboration across domains.

Scenarios and Examples:

  • Retail Company:
    • The "Product" domain manages product data in a Lakehouse, providing APIs for other domains to access product information.
    • The "Customer" domain owns customer data in a Data Warehouse, offering analytical reports and customer segmentation data products.
    • Fabric workspaces and OneLake zones ensure data isolation and ownership, while Purview enables data discovery and governance.
  • Financial Services:
    • The "Trading" domain manages real-time market data in a Lakehouse, offering data streams and analytical dashboards as data products.
    • The "Risk Management" domain owns risk data in a Data Warehouse, providing risk reports and predictive models.
    • Fabric's security features and Purview's governance capabilities ensure compliance with regulatory requirements.
  • Healthcare Organization:
    • The "Patient Records" domain manages patient data in a lakehouse, with strict access control, and data masking to protect sensitive information.
    • The "Research" domain has a workspace to access de-identified patient data for research purposes.
    • OneLake provides a central repository for all data, while Purview helps track data lineage, and ensure compliance with HIPAA.

Embracing the Future of Data Management:

Microsoft Fabric empowers organizations to adopt a data mesh architecture, unlocking the potential of their data and accelerating their digital transformation. By embracing domain ownership, data as a product, and self-serve infrastructure, organizations can build a more agile, scalable, and innovative data ecosystem.

Wednesday, November 13, 2024

Securing Your Data in Microsoft Fabric: Security Best Practices

Microsoft Fabric offers a powerful, unified analytics platform, but with great power comes great responsibility – securing your data. As you leverage Fabric for data warehousing, lakehouse architectures, and advanced analytics, implementing robust security measures is paramount. This post outlines key security best practices to protect your valuable data within the Fabric ecosystem.

Understanding Fabric's Security Layers

Fabric's security model is built on layers, encompassing:

  • Azure Active Directory (Azure AD): For identity and access management.
  • Workspace Security: Controlling access to Fabric workspaces and their contained items.
  • Data Security: Protecting data at rest and in transit.
  • Row-Level Security (RLS) and Object-Level Security (OLS): Restricting data access based on user roles and permissions.

Best Practices for Securing Your Fabric Environment:

1. Implement Strong Identity and Access Management (IAM) with Azure AD:

  • Scenario: A company has multiple departments accessing sensitive customer data within Fabric.
  • Best Practice:
    • Utilize Azure AD groups to assign roles and permissions based on job functions.
    • Enforce multi-factor authentication (MFA) to prevent unauthorized access.
    • Implement least privilege principle, granting only necessary permissions.
    • Use Service Principals when applications need to access data.
  • Example: Create Azure AD groups like "Marketing Analysts," "Sales Managers," and "Data Scientists," assigning appropriate Fabric roles to each.

2. Secure Fabric Workspaces:

  • Scenario: A project involves sensitive financial data, and access needs to be tightly controlled.
  • Best Practice:
    • Use workspace roles (Admin, Member, Contributor, Viewer) to manage access levels.
    • Regularly review workspace permissions and remove unnecessary access.
    • Create separate workspaces for different projects or data sensitivity levels.
  • Example: Create a dedicated workspace for the financial data project, granting only authorized personnel Admin or Contributor roles.

3. Protect Data at Rest and in Transit:

  • Scenario: Data needs to be encrypted to comply with regulatory requirements.
  • Best Practice:
    • Leverage Azure Storage Service Encryption (SSE) to encrypt data at rest within OneLake.
    • Ensure data is transmitted over HTTPS to encrypt data in transit.
    • Utilize Private Links to ensure that network traffic stays within the Microsoft Azure backbone.
  • Example: Enable SSE for your OneLake storage account, and configure network security groups to restrict traffic to authorized sources.

4. Implement Row-Level Security (RLS) and Object-Level Security (OLS):

  • Scenario: Sales representatives should only see data related to their assigned regions.
  • Best Practice:
    • Use RLS to filter rows based on user attributes or roles.
    • Use OLS to restrict access to specific columns or tables.
    • Implement dynamic RLS to automatically filter data based on user context.
  • Example: Create RLS rules in Power BI datasets to filter sales data based on the sales representative's region, as defined in Azure AD.

5. Monitor and Audit Security Activities:

  • Scenario: Detecting and responding to potential security breaches is crucial.
  • Best Practice:
    • Enable Azure Monitor and Azure Sentinel to collect and analyze security logs.
    • Set up alerts for suspicious activities, such as unusual login attempts or data access patterns.
    • Regularly review audit logs to identify potential security vulnerabilities.
  • Example: Configure Azure Sentinel to alert on unusual login activity from unknown IP addresses, and set up dashboards to visualize security events.

6. Data Governance and Compliance:

  • Scenario: Meeting regulatory compliance such as GDPR, HIPAA, or CCPA.
  • Best Practice:
    • Implement data classification and labeling.
    • Establish data retention policies.
    • Utilize Microsoft Purview to govern and track sensitive data.
    • Perform regular security assessments and audits.
  • Example: Use Microsoft Purview to classify sensitive customer data and implement data loss prevention (DLP) policies to prevent unauthorized data sharing.

7. Secure External Data Access:

  • Scenario: Connecting to external data sources.
  • Best Practice:
    • Use secure connection strings, and store credentials securely using Azure Key Vault.
    • Implement network security measures to restrict access to external data sources.
    • Follow the principle of least privilege when granting access to external data.

By implementing these security best practices, you can build a robust and secure data environment in Microsoft Fabric, protecting your valuable data from unauthorized access and ensuring compliance with regulatory requirements.

What are the security measures you take from within Microsoft Fabric ?

Wednesday, October 16, 2024

How Microsoft Fabric Enhances Power BI Capabilities ?

Microsoft Fabric is a unified, end-to-end analytics platform that brings together data integration, data warehousing, and data science capabilities. It is built on a foundation of open standards and modern technologies, and it is designed to help organizations of all sizes to get more value from their data.

One of the key benefits of Microsoft Fabric is that it enhances the capabilities of Power BI. Power BI is a business intelligence and data visualization tool that is used by millions of people around the world. With Fabric, Power BI users can now access a wider range of data sources, perform more complex data analysis, and create more sophisticated reports and dashboards.

Here are some of the ways that Microsoft Fabric enhances Power BI capabilities:

  • Advanced reporting: Fabric provides a number of advanced reporting capabilities that are not available in Power BI standalone. For example, Fabric users can create interactive reports that allow users to drill down into the data and explore different dimensions. Fabric also supports a variety of advanced reporting features, such as geospatial analysis, predictive modeling, and what-if analysis.
  • Data modeling: Fabric provides a powerful data modeling engine that can be used to create complex data models. This makes it easier to integrate data from multiple sources and to perform complex data analysis. Fabric also supports a variety of data modeling techniques, such as star schema, snowflake schema, and dimensional modeling.
  • Analytics: Fabric provides a number of advanced analytics capabilities that can be used to gain deeper insights into data. For example, Fabric users can use machine learning to build predictive models, and they can use natural language processing to extract insights from unstructured data. Fabric also provides a number of tools that can be used to visualize and explore data.

In addition to these benefits, Microsoft Fabric also provides a number of other advantages for Power BI users. For example, Fabric is a cloud-based platform, so it is easy to deploy and scale. Fabric is also highly secure, so users can be confident that their data is protected.

Overall, Microsoft Fabric is a powerful platform that can help organizations to get more value from their data. Power BI users who are looking to enhance their capabilities should consider using Fabric.

Here are some of the specific features of Microsoft Fabric that enhance Power BI capabilities:

  • DirectQuery for Fabric Data Factory: This feature allows Power BI users to connect directly to data in Fabric Data Factory. This can be useful for accessing large datasets that would be difficult to import into Power BI.
  • Power BI integration with Fabric Data Flow: This integration allows Power BI users to use Fabric Data Flow to transform and clean data before it is imported into Power BI. This can help to improve the quality of data and make it easier to use in Power BI reports.
  • Power BI integration with Fabric Lakehouse: This integration allows Power BI users to access data in Fabric Lakehouse. This can be useful for accessing data that is not available in other formats, such as unstructured data.
  • Power BI integration with Fabric Data Science: This integration allows Power BI users to use Fabric Data Science to build and deploy machine learning models. This can be used to add predictive capabilities to Power BI reports.

If you are a Power BI user, I encourage you to learn more about Fabric and how it can help you to get more value from your data.

In addition to the features mentioned above, Microsoft Fabric also provides a number of other benefits for Power BI users, such as:

  • Improved performance: Fabric is a high-performance platform that can handle large datasets and complex queries. This can help to improve the performance of Power BI reports.
  • Increased security: Fabric is a secure platform that uses a variety of security measures to protect data. This can help to ensure that your data is safe and secure.
  • Reduced costs: Fabric can help to reduce the costs of using Power BI. For example, Fabric can be used to reduce the amount of data that needs to be stored in Power BI.

If you are interested in learning more about Microsoft Fabric, I encourage you to click here Get started with Microsoft Fabric

I hope this blog post has been helpful. If you have any questions, please feel free to leave a comment below.

Thank you for reading!

Friday, September 20, 2024

What Load Type should I choose when I am loading data from source to bronze layer ?

When determining the appropriate load type (full, initial/incremental, or CDC) for your SQL database tables into a Bronze layer, you need to consider several key criteria. Here's a breakdown:

1. Data Volume and Table Size:

  • Full Load:
    • Suitable for small to medium-sized tables where a complete refresh is feasible within acceptable timeframes.
    • Also appropriate for tables where historical changes are not critical.
  • Initial/Incremental Load:
    • Essential for large tables to avoid overwhelming system resources with frequent full loads.
    • Necessary when only changes need to be reflected in the Bronze layer.
  • CDC (Change Data Capture):
    • Best for tables with high transaction volumes and a need for near real-time data updates.
    • Required when capturing every change (inserts, updates, deletes) is crucial.

2. Change Frequency and Volatility:

  • Full Load:
    • Acceptable for tables with infrequent changes or where changes are made in large batches.
  • Initial/Incremental Load:
    • Necessary for tables with moderate to frequent updates.
  • CDC:
    • Mandatory for tables with very frequent changes and a demand for low-latency data replication.

3. Availability of Change Tracking Mechanisms:

  • Full Load:
    • No specific requirement.
  • Initial/Incremental Load:
    • Requires a reliable method to identify changes, such as:
      • Timestamps (e.g., "modified_date," "created_date" columns).
      • Version numbers.
      • Status flags.
  • CDC:
    • Relies on database-level CDC features or transaction logs.

4. Data Dependency and Relationships:

  • Consider the dependencies between tables. If a table is a parent table, and many child tables depend on it, then changes in the parent table may require changes in the child tables.
  • This can impact the complexity of incremental loads and CDC.

5. Performance Requirements:

  • Full Load:
    • Can put a significant strain on source and target systems.
  • Initial/Incremental Load:
    • More efficient than full loads, but requires careful optimization.
  • CDC:
    • Can add overhead to the source database, so it's important to assess the impact.

6. Data Retention and History:

  • Full Load:
    • Replaces the entire table, so historical data is lost unless explicitly archived.
  • Initial/Incremental Load:
    • Preserves historical data, but may require additional logic to track changes.
  • CDC:
    • Provides a detailed history of all changes.

7. Business Requirements:

  • Consider the business needs for data freshness and accuracy.
  • Real-time reporting may necessitate CDC, while less time-sensitive reporting may be satisfied with incremental or full loads.

Practical Approach:

  • Categorize Tables: Group tables based on their characteristics (size, change frequency, importance).
  • Prioritize: Focus on the most critical tables first.
  • Evaluate Change Tracking: Determine if suitable change tracking mechanisms exist.
  • Proof of Concept: Test different load types on a subset of tables.
  • Document: Create a detailed plan outlining the load type for each table and the rationale behind it.

By carefully evaluating these criteria, you can develop a robust and efficient data loading strategy for your Bronze layer.

Wednesday, August 14, 2024

Fabric Data Warehouse vs. Lakehouse: Choosing Your Data Destination


Microsoft Fabric offers two powerful data storage and analytics options: the Data Warehouse and the Lakehouse. While both serve as central repositories, they cater to different needs and workflows. Understanding their distinctions is crucial for selecting the right solution for your data strategy.

The Fabric Data Warehouse: Structured Precision

Think of the Data Warehouse as a meticulously organized library. It's built for structured, relational data, optimized for fast, complex queries, and designed for traditional business intelligence (BI) workloads.

  • Key Characteristics:

    • Structured Data: Primarily handles data with predefined schemas (tables, columns, relationships).
    • SQL Focus: Relies heavily on T-SQL for data manipulation and querying.
    • Performance Optimization: Designed for high-performance analytics on structured data.
    • Transactional Consistency: Ensures data integrity with ACID properties.
    • BI and Reporting: Ideal for creating reports, dashboards, and analytical applications.
  • Example Scenario:

    • A retail company needs to analyze sales data to understand product performance, customer behavior, and regional trends. They have structured data from their point-of-sale systems, CRM, and inventory management. The Data Warehouse is perfect for this, allowing them to create efficient reports on sales, inventory levels, and customer demographics.

The Fabric Lakehouse: Flexible Data Exploration

The Lakehouse, on the other hand, is like a vast, flexible archive. It can store any type of data—structured, semi-structured, and unstructured—and is designed for data exploration, data science, and machine learning.

  • Key Characteristics:

    • Multi-format Data: Supports various data formats (Parquet, CSV, JSON, images, videos).
    • Open Formats: Uses open-source formats and APIs for interoperability.
    • Data Science & ML: Provides a platform for data exploration, model training, and feature engineering.
    • Flexibility & Scalability: Offers high scalability and flexibility for diverse data workloads.
    • Data Engineering: supports various data engineering tasks, including ETL/ELT.
  • Example Scenario:

    • A media company wants to analyze social media sentiment, video streaming data, and website traffic to understand content performance. They have a mix of structured data from their content management system and unstructured data from social media feeds and video logs. The Lakehouse is ideal for this, allowing them to store all data in one place, perform data exploration, and build machine learning models to predict content popularity


Key Differences Summarized:


  • Choose the Data Warehouse when:
    • You primarily work with structured data.
    • You need high-performance SQL queries for BI and reporting.
    • You require strong data governance and ACID transactions.
  • Choose the Lakehouse when:
    • You work with diverse data types and formats.
    • You need a flexible platform for data science and machine learning.
    • You want to explore data and build advanced analytics applications.
    • You need to perform various data engineering tasks.

Fabric's Power: Integration

The real power of Microsoft Fabric lies in its seamless integration of these two solutions. You can combine the strengths of both by using the Lakehouse for data ingestion, transformation, and exploration, and then move the refined, structured data to the Data Warehouse for high-performance BI and reporting. This unified approach allows you to build a comprehensive data platform that meets all your analytics needs.

Monday, June 17, 2024

Free Power BI Classes for Week 7 (Last)

Just completed the last class of the Free Power BI classes of this series. 


Today we have covered


Adding a canvas background

Adding Image

Creating Bookmarks

Adding Custom Visuals.


Also completed the Lab 4 as well which included publishing the report to Power BI Service, creating a dashboard, autocreate a report, Quick Insights Navigation bar in the Power BI Service, creating workspaces and many others.


Thanks to all those who have attended and all those who are following the videos in their own time


You can find the video here


Monday, June 10, 2024

Free Power BI Classes 2024 Week 6

Today we have started Lab 3 in the free Power BI classes where we covered the below topics


  • Line and Clustered Column Chart
  • Formatting of various visuals
  • Gauge Visual


Here is a link to the youtube  recording


Thursday, June 06, 2024

Mastering Data Engineering Tasks in Microsoft Fabric

Microsoft Fabric is a powerful platform that offers a comprehensive set of tools for data engineering tasks. In this blog post, we will provide in-depth technical guidance on data transformation, cleansing, and optimization within Fabric. We will also include scenarios and examples to help you get started.

Data Transformation

Data transformation is the process of converting data from one format or structure to another. This is often necessary to make data compatible with different systems or to prepare it for analysis. Fabric provides a number of tools for data transformation, including:

  • Data Flow: A visual tool for creating data transformation pipelines.
  • Spark: A powerful distributed computing engine for large-scale data processing.
  • SQL: A language for querying and manipulating data.

Data Cleansing

Data cleansing is the process of identifying and correcting errors in data. This is important to ensure that data is accurate and reliable. Fabric provides a number of tools for data cleansing, including:

  • Data Quality Services: A service for monitoring and improving data quality.
  • Data Profiling: A tool for analyzing data to identify potential errors.
  • Data Cleansing Transformations: A set of transformations for cleaning data, such as removing duplicates, filling in missing values, and correcting invalid values.

Data Optimization

Data optimization is the process of making data more efficient to store and query. This can be done by:

  • Compressing data: Reducing the size of data to save storage space.
  • Partitioning data: Dividing data into smaller chunks to improve query performance.
  • Indexing data: Creating indexes to speed up data retrieval.

Scenarios and Examples

Here are some scenarios and examples of how you can use Fabric to perform data engineering tasks:

  • Transforming data from a CSV file to a Parquet file: You can use Data Flow to transform data from a CSV file to a Parquet file. Parquet is a columnar storage format that is more efficient to store and query than CSV.
  • Cleaning data by removing duplicates: You can use the Data Quality Services to identify and remove duplicate records from your data.
  • Optimizing data for querying: You can use the Data Optimization service to compress and partition your data to improve query performance.

Fabric is a powerful platform for data engineering tasks. By following the guidance in this blog post, you can effectively transform, cleanse, and optimize your data.

Additional Resources

I hope this blog post has been helpful. If you have any questions, please feel free to leave a comment below.

Monday, June 03, 2024

Free Power BI Classes for Week 5

 Successfully completed the Power BI Classes for Week 5

Completed Lab 2 and Covered the below topics


  • Adding a slicer
  • Creating a Date Dimension using DAX
  • Hiding a column from the model
  • Creating a relationship
  • Created Product Hierarchy
  • Created matrix visual
  • Created measures for Previous Year Sales and % Growth


Explained the difference between Calculated Column and measures  

Here is the link to the recording.  If anyone wants to start learning Power BI please get in touch with me  


Monday, May 27, 2024

Free Power BI class for Week 4

Successfully completed the Power BI class for Week 4 


We continued on Lab 2

Covered the following topics

  • Create for Stacked Column Chart
  • Interactivity of the visuals on a page
  • Filters on the visual and Filters on a Page
  • Formatting of Visuals
  • Drill up, Drill down Show as table
  • Create a group for Manufacturer


Learnings from troubleshooting after the class to resolve a couple of issues are as below


💡 Zip column must always be a text and change the data type as early in the steps as possible

💡 Make sure the order of columns are the same in the Append Query


Tuesday, May 21, 2024

Free Power BI Classes for Week 3.

Yesterday I have completed the Power BI Classes for Week 3

Completed Lab 1 and started Lab 2

Covered the below topics


  • Appending two tables
  • Adding a conditional column
  • In Lab 2 explained data modelling concepts like Facts, Dimensions, Star Schema and Snowflake schema
  • Discussed one to many, many to one and many to many relationships
  • Created new columns to get over the many to many relationship scenario too
  • Finally created a clustered column chart 


Here is the link to the recording 


Monday, May 13, 2024

Free Power BI Classes for week 2

Just now completed the free Power BI Classes for week 2.

Continued to work on Lab 1.  Covered the below topics

  • Importing files from a Folder
  • Transforming Data operations like 
    • Renaming Tables and columns
    • Splitting columns
    • Adding Columns By Examples
    • Transposing Columns
    • Removing Unwanted Rows


Here is the link to the recording for all those who want to start off with Power BI 


Monday, May 06, 2024

Free Power BI Classes Online -- Week 1

Today I have started free Power BI classes

These classes are aimed at people who are new to Power BI.  I will be covering the Dashboard in a Day labs over 6 weeks.

We had some technical issues with people not able to see the chat.  But ultimately was able to share the material required for the labs.

Today we started off with Lab 0 and Lab 1.

Here is the link to the recording for all those who want to start off with Power BI 


Friday, April 26, 2024

Need admin approval -- Azure webapp message

Challenge encountered

Today one of my colleague could not access a webapp that I have created in our Azure Tenant.  The error is as follows


Resolution for this:

Follow the below steps to resolve this 

Step 1 Go to Microsoft Entra ID as shown below


Step 2 Choose Enterprise Applications as shown below:


Step 3 Choose Consents and Permissions as shown below:


Step 4  Choose Admin Consent Settings as shown below :


Step 5 Choose Permissions as shown below


These steps will give access to the webapp to the user.  Hope your issue is resolved.


Thursday, March 28, 2024

Navigating the Data Science Seas: A Journey with Microsoft Fabric


Data science is a vast and exciting field, brimming with the potential to unlock valuable insights. But like any seafaring voyage, navigating its currents can be challenging. Data wrangling, complex models, and siloed information – these are just a few of the obstacles that data scientists encounter.

Fortunately, there's a trusty first mate to help us on this journey: Microsoft Fabric. Fabric isn't a single tool, but rather a comprehensive set of services designed to streamline the data science workflow. Let's set sail with an example to see how Fabric equips us for smoother sailing.

The mission of a data scientist is to develop a model to predict when a customer will stop using a service (customer churn). Here's how you can use Fabric can be your guide

Predicting Customer Churn

Let's dive deeper and explore the steps involved in building a customer churn prediction model using Microsoft Fabric.  You can get started by signing into http://fabric.microsoft.com  using your cruise tickets for your data science journey.

Step 1: Data Discovery & Acquisition

  • Mapping the Treasure Trove: Utilise Microsoft Purview, the unified data governance service within Azure Portal. Purview acts as your treasure map, helping you discover relevant datasets related to customer demographics, purchase history, and marketing interactions.  You can add your own datasets and register them.
  • Charting the Course: Once you've identified the datasets, leverage Azure Data Factory to orchestrate data extraction, transformation, and loading (ETL) processes. Data Factory acts as your captain, guiding the data from its source to your designated destination (e.g., One Lake). You can also avoid the above two steps and directly chart your course with the existing open datasets and notebooks available in the sea of Microsoft Fabric which is what we will be doing here.
  • Unveiling the Data in OneLake: As you navigate the vast seas of ocean (data), OneLake, a central data repository within Fabric, serves as your treasure trove. Utilise the Lakehouse item, your personal submarine, to explore and interact with the relevant datasets that are crucial for your customer churn prediction mission.  After signing in, enter into the Data Science cabin as shown in the below image


 We will be using an existing sample on Customer Churn that is available within Fabric.

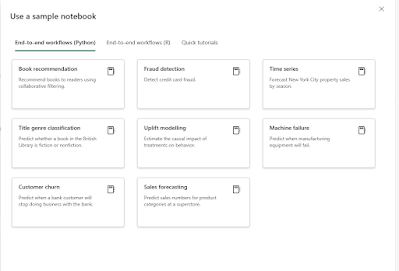
Click on Use a Sample as shown below


Choose the Customer Churn Sample from the list of samples as shown below
 
This opens the customer churn notebook within the Fabric.


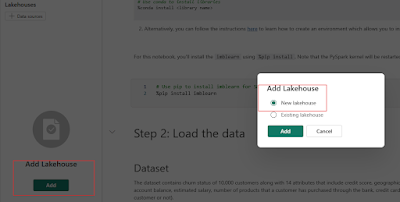
  • Attaching the Lakehouse to Your Notebook: Effortlessly connect the Lakehouse containing your relevant datasets to your analysis Notebook. This allows you to browse and interact with the data directly within your notebook environment. 
To do this click on lakehouse link section of the left navigation pane of the Notebook as shown below and create a New Lakehouse


  • Prepare for sailing: Bring the right luggage for sailing by installing the right libraries. To do this run the below code using the pip install command from the notebook as shown below
 

Prepare your travel documents by exploring the dataset that you are going to use which is the bank dataset that contains churn status of 10,000 customers with 14 attributes.  Run the below configuration to prepare as shown below


Prepare to combat seasickness by downloading the dataset and uploading it to the lakehouse by running the cell as shown below


  • Seamless Data Reads with Pandas: OneLake and Fabric Notebooks make data exploration a breeze. You can directly read data from your chosen Lakehouse into a Pandas dataframe, a powerful data structure for analysis in Python. This simplifies data access and streamlines the initial stages of your data exploration.
Prepare your groceries by running the next two cells and create a pandas dataframe as shown below


Plan your sailing itinerary by running the next two cells as shown below


Step 2: Data Wrangling & Preparation
  • Setting Sail with DataWrangler: DataWrangler, your powerful workhorse, welcomes the acquired data frame.  Here, you'll have an immersive experience to clean and prepare the data for analysis. This might involve handling missing values, encoding categorical variables, and feature engineering (creating new features based on existing ones).
Have the main mooring lines looped through to manouver by running the datawrangler from the Data tab of the notebook as shown below


Choose the dataframe that you created in the next screen as shown below


Now the Data Wrangler is launched, expand the find and replace and click on the drop duplicate rows as shown below


This will create the code for dropping the duplicate rows from the dataframe if there are any as shown below


  • Exploring the Currents: Perform Exploratory Data Analysis (EDA) to understand the data's characteristics. Identify patterns and relationships between features that might influence customer churn. 
Start moving only after checking that no other boat is already manoeuvring in the same channel arm by running the next three cells as shown below 


Also run the five number summary as shown below


Explore further by running the distribution of the exited and non exited customers as shown below


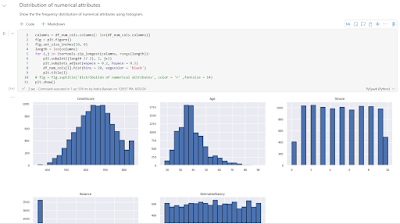
Run the distribution of numerical attributes


Perform feature engineering and one hot encoding


As a final step of Exploratory data analysis create a delta table by running the delta table code as shown below.  You can also see the delta table named df_clean created in the lakehouse.


Step3: Building & Training the Model
  • Choosing Your Vessel: Azure Machine Learning serves as your shipbuilder. Here, you can choose and configure a machine learning algorithm suitable for churn prediction. Popular options include Logistic Regression, Random Forest, or Gradient Boosting Machines (GBMs).

Run the code in Step 4 of the notebook as shown below that will load the delta table and generate the experiment.
 
Now run the code that sets the experiment and auto logging, imports the scikit learn libraries and prepares the training and test data as shown below
 

  • Training the Crew: Split your prepared data into training and testing sets. The training set feeds the algorithm, allowing it to "learn" the patterns associated with customer churn.

Now apply SMOTE to the training dataset and run the below query
 
Now train the model with Random Forest as shown below


Train the model with LightGBM too as shown below


  • Fine-Tuning the Sails: Use hyperparameter tuning techniques to optimize the chosen algorithm's performance. This involves adjusting its parameters to achieve the best possible accuracy on the training data.
Track the model performance by observing the model metrics as shown below
 
Step 4: Evaluation & Deployment
  • Testing the Waters: Evaluate your model's performance on the unseen testing data. Metrics like accuracy, precision, and recall will tell you how well the model predicts churn.
Load the best model and assess the performance against the test data as shown below
 
  • Refinements & Improvements: Based on the evaluation results, you might need to refine your model by trying different algorithms, features, or hyperparameter settings. Iterate until you're satisfied with its performance.
Check the confusion matrix results as shown below
 
  • Deploying the Model: Once the model performs well, save the prediction results to a delta file in the Lakehouse.
Save the results into the lakehouse by running the code as shown below
 

Step 5: Visualization & Communication
  • Charting the Future: Leverage Power BI, seamlessly integrated with Fabric, to create compelling visualizations of your churn predictions. Segment customers based on their predicted churn probability, allowing for targeted interventions.
An example screenshot of the Power BI Visualisation is as below
 

  • Sharing the Treasure: Communicate your findings to stakeholders. Use Power BI dashboards to showcase the model's effectiveness and its potential impact on reducing customer churn.
This blog post demonstrates how Microsoft Fabric acts as your comprehensive toolkit, guiding you through the entire customer churn prediction journey!


OneLake: The Heart of Your Data Universe in Microsoft Fabric

Imagine a single, unified data lake for your entire organization, accessible to every workload, without data duplication. That's the pow...