Today after a long time, I wanted to play around with Azure Machine Learning Designer formerly Machine Learning Studio.
So I set our to create a Predictive Model using the Sample data that is available in Azure ML -- Automobile price data (Raw)
So I logged in to Azure Portal --
Creating a Machine Learning Workspace
The first step is to create a Machine Learning Resource --
So for that Click on Create a Resource Button and search machine learning as shown below:
Click on Azure Machine Learning
The below screen appears.
Fill in the Resource Group, Workspace Name and Region details.
Fill in other details in the other tabs if needed and click on Review and Create
Now the Azure Machine Learning Workspace is created as below
Click on the Name of the AML workspace
The below screen appears.
Click on Launch Studio. This will launch the Azure Machine Learning (AML) interface.
Click on the Create New -- This opens up the Menu of what can be created as shown below.
Ingesting Data
Click on Pipeline. This will create a New Pipeline Menu as shown below
As you can see it uses the Designer Authoring tool. Now Click on the Plus button which is Create a pipeline using classic pre-built components.
This will open a blank canvas in the designer as shown below:
Now we are ready to create a training model. Click on the two arrows beside Undo as shown in the above image. This will open a Menu which contains the components that can be used to build the predictive model as shown below:
Click on Sample data and drag the dataset named Automobile Price Data (Raw) on to the blank canvas
You can right-click the Automobile price data (Raw) component and select Preview Data to understand the dataset.
Each row corresponds to an automobile, and the variables associated with each automobile appear as columns. There are 205 rows and 26 columns in this dataset.
Preparing Data
Now that we have chosen the dataset we need to clean the data.
First step in preparing data is to eliminate columns that we do not need
Second step is to remove the missing values.
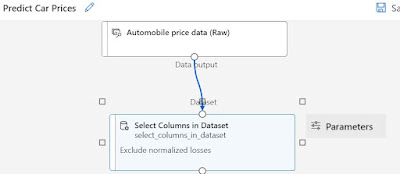
So if you look at the dataset carefully, there are many values missing from the column normalized-losses. So we need to eliminate this column. To achieve this, we can use the Select Column in dataset component as shown below.
Now connect the Dataset component with the Select Columns component.
Double click on the New component and choose Edit Columns and create the rules as below to Include All columns Except the column named normalized-losses
Double Click on the Clean missing data component and change as shown below.
Preparing Training and test data
Now that we have prepared and cleaned the dataset, the next step is to prepare the train and test data, For this we will use Split Data component. Search for the Split Data component and drag it to the canvas. Connect the Clean Missing data component to the Split Data component. Make sure that the Cleaned dataset port is connected as shown below.
Double click the Split Data component and configure as shown below. The 0.7 in the Fraction of rows in the first output dataset. means that the dataset will be split into 70% and 30%. The 70% dataset will be used for training a model and 30% dataset can be used as a test dataset.
Training a Model
The Next Step is to train a model. From the data we are going to Predict the Price of the automobile. So we will use a linear regression model. So Search for the Linear Regression component and drag it to the canvas. Next search for a Train Model and drag it to the canvas. And connect these components as shown below.
Next add the components -- Score Model and Evaluate Model on to the canvas and connect them as shown below:
Now your Pipeline is ready.
Next Steps ---
In order to train this model, you need to click on the Submit button
Once you submit you will be prompted with the below configuration.
Ensure that you have configured the Compute Target as well as shown below
This will create a pipeline job and a notification will pop up at the top right corner of the page. Since this is your first job, this might take up to 20 mins to run. Once you get the notification that the job is completed, you can look at the job detail page as shown below.
You can then look at the scored labels and price predicted as shown below.
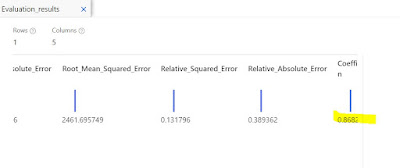
You can use the Evaluate Model to see how well the trained model performed on the test dataset as shown below
You can see the error statistics above. For each of the error statistics, smaller is better. A smaller value indicates that the predictions are closer to the actual values.
For the coefficient of determination, the closer its value is to one (1.0), the better the predictions.
That's it from me for today.
In my next blog post I will show you how you can deploy this model.


