Showing posts with label Power BI. Show all posts

Monday, May 13, 2024

Free Power BI Classes for week 2

Just now completed the free Power BI Classes for week 2.

Continued to work on Lab 1.  Covered the below topics

  • Importing files from a Folder
  • Transforming Data operations like 
    • Renaming Tables and columns
    • Splitting columns
    • Adding Columns By Examples
    • Transposing Columns
    • Removing Unwanted Rows


Here is the link to the recording for all those who want to start off with Power BI 


Thursday, January 09, 2020

Video of my webinar "Webscraping in Power BI"

The video of my webinar on "Webscraping in PowerBI"  is now available on Microsoft Power BI youtube channel.

Here is the link for the same


The presentation materials are at the below link.

https://github.com/indupriya9/webscraping


Thursday, December 12, 2019

My session materials for Webscraping in Power BI Webinar

@Kelly Kaye thanks for the opportunity to present a Webinar for the Power BI Community yesterday. My topic was  'Webscraping in Power BI''.
Below is the link to presentation material and PBIX demo files on github.
https://github.com/indupriya9/webscraping

I will share the link of the webinar as soon as it is available

Thursday, November 21, 2019

Power BI Competition for Kids aged between 9 and 14 yeaars

On Monday the 18th November, I have concluded the 14 weeks databases and data visualisation classes by running a #powerbi data visualisation competition for kids.   #mvpbuzz

Extremely happy that Reza Rad and Leila Etaati have agreed to be the judges for this #powerbi nz competition for the second time in a row.

I have given the links to makeovermonday website to choose their own data and come up with their visualisations. Altogether 14 kids participated in the competition and they were amazing.

I sincerely thank all the kids and parents Anusha Pushparajan, Puvana, Sreesutha Nampally, Vinaya Shetty, Govardhani, Swathi and  all others who are not there on LinkedIn for all their extended support without which the event would not have been successful.  Now I feel that the kids have learnt something useful over the last 14 weeks. :) 

Below are the photos of the top 3 winners of the competition. If anyone is interested in watching the videos of the kids presentations you can access the below link  https://drive.google.com/drive/folders/1fQafgnyKAUTBP2XXxqE4W_AVgz7ApKs6?usp=sharing


Tuesday, October 15, 2019

Free Databases and Data Visualisations course for kids Weeks 9 to 11 update

It has been quite a while since I have posted about the free databases and data visualisation classes for 9 to 14 year old kids.  So here I am with an update.  In the SQL test that was conduced in week 8, about 10 kids have written taken the test.  All of them have scored more than 80% except for 1 person who scored 70%.  I am pleased with the overall result.

For the last 3 weeks, I have started teaching Power BI to the kids.  Three more kids have joined the Power BI classes. I taught basics of importing data using a csv file.  Also gave an overview of the 3 views in Power BI Desktop, query editor, Applied steps pane, removing columns etc.

I have also covered about new columns and measures  what the main difference is between columns and measures. I have covered various visualisations in the Report View by explaining them what a measure and dimension is.

Next week I have asked everyone to pick a dataset on their own and come up with their data visualisations.  So waiting for their creativity to unveil.


Tuesday, September 10, 2019

Free Databases and Data Visualisations course for kids Week 7 update

Had a great time this week with kids who attended the SQL course yesterday. #sqlfamily #microsoftnz #mvpbuzz

This week they learnt how to import data from a csv file.  After they imported the file, I have asked them to view what they have imported and most of the kids started writing the select queries for all my questions. I again had a short recap of the last week's session covering update, delete and basic SQL functions.

In the next session, I will be organising a test to understand how much they have learnt.


Monday, September 09, 2019

Final Submission for Back to School Power BI Competition

As mentioned in my previous posts, the kids have finally completed their power BI files and I have successfully towards the BAck to School Power BI competition.

The details of the submissions are as follows:

Career Pathways

https://community.powerbi.com/t5/Data-Stories-Gallery/Career-Pathways-Back-to-School/td-p/785700

Historical Events

https://community.powerbi.com/t5/Data-Stories-Gallery/Study-of-Historical-Events-Back-to-School/td-p/786138

Road Safety

https://community.powerbi.com/t5/Data-Stories-Gallery/Road-Safety-Back-to-School/td-p/785683


Climate News

https://community.powerbi.com/t5/Data-Stories-Gallery/Climate-News-Back-to-School/td-p/785721

If you like what the kids did, please like them without any hesitation.  This will boost their confidence levels 

Friday, August 30, 2019

Participation in Back to School Power BI competition progress

As mentioned in my previous post, all kids have been working hard on their power bi files.

The following are the topics chosen by the kids for the Back to School Power BI competition (4 groups)

Career Pathways
Climate Changes/News
Road Safety
Historical Events

I had a chance to look at the first draft of the power BI files created.  Suggested some changes to improve them further. 

One of the groups were having difficulty in getting the data into Power BI, so helped them with that. 

One of the groups started developing the power BI visualisations directly in the app.powerbi.com as they thought that sharing between them would be easier.  Since you cannot convert the visualisations developed in the app to power bi desktop file, they had to recreate everything in the power b desktop from scratch.  This was a big learning for them.  But they quickly did that.

One of the groups wanted to know how to get data from a website, so pointed them to my webinar on "Top 10 tips" which they could use to create their visualisations.

The Road Safety group created a game that was meant to be interactive.  But when I tried to use it, I didnot find that it was very interactive.  So I have suggested to make some changes.

Some of the photos from this catch up


Thursday, August 22, 2019

My presentation at the Power Platform Summit Melbourne Australia

I really enjoyed presenting at the Power Platform Summit, Melbourne Australia.  The topic was "Top 10 things every Power BI creator should know.

Had really good audience who were really engaged and with a lot of questions.

Here is the link to the session materials
https://github.com/indupriya9/powerplatformsummit2019


Tuesday, August 13, 2019

Initiating kids to participate in Back to School Power BI Competition organised by Microsoft

I have seen this tweet from Charles Sterling regarding Back to School Power BI Competition.

Since I have taught Power BI for 11 11 to 15 year old kids last year, I thought lets try and submit a few Power BI files if they are interested.  So I had a session with them today where I went through the Back to School Power BI competition rules.  I have initially created 3 groups making three 16 year olds as leaders to these 3 groups. 

I have asked them to spend some time and come up with ideas for creating Power BI visualisations for this competition.  Each team came up with a few options. 

The three 16 year old kids came to me and said that they want to make a separate group and create an app using Power BI that is useful for high school kids to choose their career pathways.  So the 4th group was created.

Now we have 4 groups trying to create Power BI visualisations.  I am anxiously waiting to see what they finally decide to work on.  We are meeting again in a week's time


Monday, April 15, 2019

My presentation materials for the power bi virtual days webinar

@powerbidays thanks for the opportunity to present at the virtual conference yesterday. My topic was 'Sentiment Analysis Using Cognitive Services in Power BI'.
Below is the link to presentation material and json code on github.
https://github.com/indupriya9/PowerBIDays-April-2019


Here is a link to the webinar on the same topic I did on PASS Marathon that you can use to follow my demo

https://www.youtube.com/watch?v=Trtrgy59vSw&feature=youtu.be 

Thursday, March 21, 2019

My first webinar session in PASS Marathon


My session from the hashtag#passmarathon this morning is here.  The topic is Sentiment Analysis using Cognitive Services in Power BI.


You can download the slides from this link beforehand
https://lnkd.in/gXSAmav

I will post the link to the webinar as soon as it is available,


Saturday, February 23, 2019

My Presentation for SQL Saturday Wellington 2019

Had a really great time presenting at hashtag#sqlsatwellington last Saturday on the topic Top 10 tips every hashtag#PowerBI Developer should know.
Had really great questions from the audience. as well.

You can download the presentation from here

Thanks to Anupama Natarajan Phil Seamark and Dave Dustin for this opportunity.

Wednesday, December 05, 2018

Power BI Did You Know -- Series 1 (Contact Us button)

Did you know that you can add a contact us button in your Power BI reports ?

Here is how you add a contact us button in your power bi report.

Step 1:  Go to your Power BI report
Step 2:  Add a text box

Step 3:  Type in * as shown below: (1)


Step 4:  Change the font of the * to Windings as shown below:(2)  This will convert the * to an envelope


Step 5: Now add a mailto link to the envelope button as shown (3)


Step 6:  You can test this in Power BI Desktop by using CTRL+Click. This will open a new email with the default account. When you publish to the Power BI service, you can click on the envelope to open a new email with the default account as shown below:


Got this tip from Charles Sterling Microsoft Power BI Program Manager.

You can use the  decoder link to translate between normal font and Windings font and add hyperlinks to the same by using the DECRYPT button on the decoder link.  For example you can use '(' to add a phone button.

Similarly you can use the ENCRYPT button on the decoder link to find out what symbol each of the Alphabets and numbers represent in Windings font.


Tuesday, October 09, 2018

Power BI Competition for Kids aged between 11 and 15

Yesterday I have concluded the 12 weeks databases and data visualisation classes by running a #powerbi data visualisation competition for kids.  

Extremely happy that Reza Rad and leila Etaati have agreed to be the judges for this first ever #powerbinz competition.  
11 kids participated and I have given them the links to makeovermonday website to choose their own data and come up with their visualisations.

I sincerely thank all the kids and parents Bindu HandaSurya AtmalaSreesutha NampallyRajnish Suri, PMP and  all others who are not there on LinkedIn for all their extended support without which the event would not have been successful.  Now I feel that the kids have learnt something useful over the last 12 weeks. :)  

Below are the photos of the top 3 winners of the competition. If anyone is interested in watching the videos of the kids presentations you can access the below link  https://drive.google.com/open?id=185DKP5DxBl0Lfb9rxPcxmdKAPbhMHJHD 


Wednesday, September 26, 2018

Free Databases and Data Visualisations course for kids Week 8 to 11

It has been quite a while since I have posted about the free databases and data visualisation classes for 11 to 15 year old kids.  So here I am with an update.  For the last 3 weeks, I have taught basics of importing data from the Web using the URL and using a csv or a excel file.  Also gave an overview of the 3 views in Power BI Desktop, query editor, Applied steps pane, removing columns etc.

I have also covered about new columns and measures  what the main difference is between those 2. Also covered very basic DAX functions, explained about the date dimension, Bookmarks and drillthoughs.

Next week I have asked everyone to pick a dataset on their own and come up with their data visualisations.  So waiting for their creativity to unveil.

Also wanted to thank @Reza and @Leila from #Radacad for sponsoring biscuits for kids.  They have been enjoying them for the last 3 classes.


Tuesday, April 03, 2018

Extracting Power BI Usage Statistics from Power BI Report Server

Today I had a thought of monitoring the usage of Power BI Reports.

So I started exploring the PowerBIReportServer database and see whether there are any statistics that I could utilise.  The database had views of executionlogs that are similar to the SSRS ReportServer database.  After studying all the available views, I came up with this stored procedure to monitor the usage of the Power BI Reports.


USE PBIReportServer
Go

SET ANSI_NULLS ON
GO
SET QUOTED_IDENTIFIER ON
GO

Create PROCEDURE [dbo].[PBI_Usage_Stats] 

AS

BEGIN

SELECT [InstanceName]
      ,[ReportPath]
      ,[UserName]
      ,[TimeStart]
      ,[TimeEnd]
      ,[TimeDataRetrieval]
      ,[TimeProcessing]
      ,[TimeRendering]
      ,[Source]
      ,[Status]
      ,[ByteCount]
   FROM [PBIReportServer].[dbo].[ExecutionLog2]
  where Status = 'rsSuccess' and ReportPath != 'Unknown' and Bytecount > 0
  and username not like 'NT SERVICE%' 
End

Wednesday, March 21, 2018

Migrating to Power BI Report Server – March 2018 from Power BI Report Server – October 2018


Last night, I found out that the Power BI Report Server – March 2018 update is available for download.  So I was very excited to install this and use it for a brand new Power BI report that I was doing.

Again, this has two steps in the migration process as outlined in my previous article of Migrating SSRS 2014 to SSRs 2017.

  •       The first step is to Install the new release of Power BI Report Server on a different machine. 
  •      The second step is to migrate the existing Power BI reports into the new installation.


So here you go – with a run down of the steps that I have followed to migrate.  I did not do an in place upgrade.

Step 1
Installing Power BI Report Server – March 2018

Downloaded the new Power BI Report server from the below link


When you click on the Download button – you will be prompted to choose the files as shown below.  Choose the relevant files and click next


When the download is completed, run the installer file named PowerBIReportServer.exe
Here are some screenshots from my installation.


Choose Developer from the below screen.


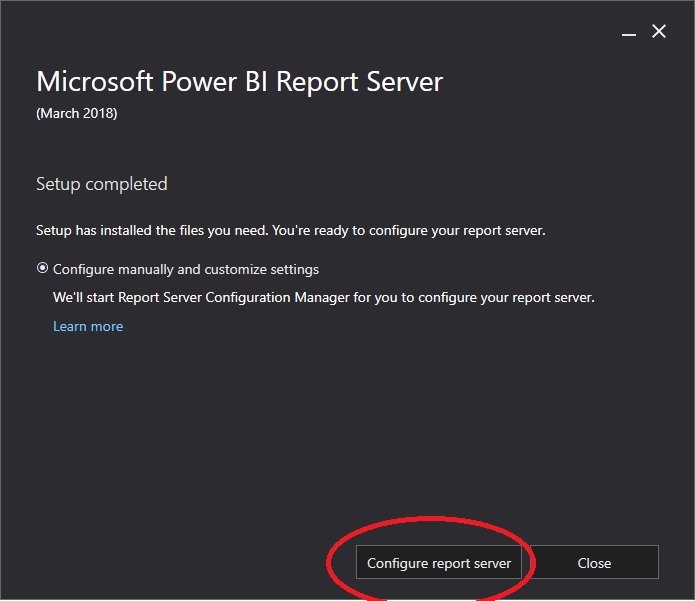
Click on the Configure Report Server on the below screen to configure Power Bi Report Server.


When the Reporting Services Configuration launches, make sure you choose the correct instance.
My installation Is showing two instances in the dropdown because I also have a SSRS installation on this server.
I choose the PBIRS as I am configuring the Power BI Report Server.


Service Account Tab  -  Just use the default


Web Service URL Tab  --  


Make sure you are changing the default ReportServer virtual directory to PBIReportServer and clcik Apply


Database Tab  -- On the Database -- click on change Database and create New Database

 Keep the Authentication Type -- Current User -- Integrated Security


 In the below screen ensure that the ReportServer is changed to PBIReportServer.  Then the tempdatabase will automatically change to PBIReportServerTemp database.


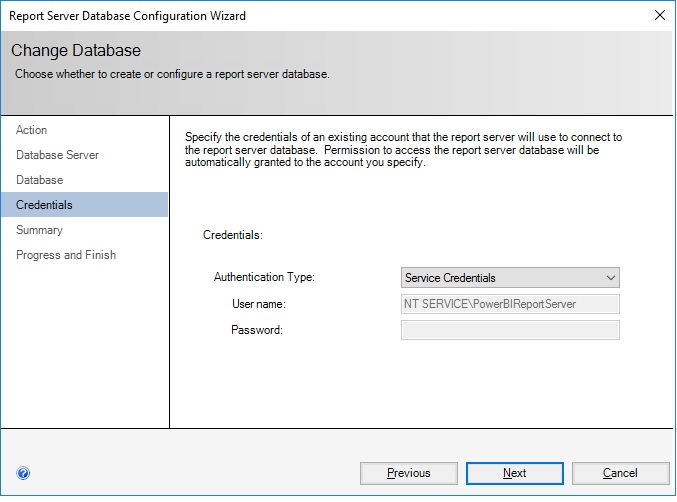
 Under Credentials -- Leave the Authentication Type to Service Credentials a shown below.


 Then Click Apply


Web Portal URL Tab -- Under this ensure that the virtual directory is changed to PBIReports from Reports and then click Apply


I did not change any other tabs.  Click Exit from Report Server Configuration Manager


Step 2
Migrate the existing Power BI reports into the new installation of Power BI Report Server March 2018

The next step is to migrate the existing Power BI reports into the new installation.  To do this, follow the below steps.

  • 1Back up the PBIReportServer and PBIReportServerTemp databases from the old Power BI Report Server October 2017 Services installation. 


  • 2.Restore these two databases on to the new Power BI Report Server installation.


Now you will find the reports from the old SSRS server in the new SSRS server if you browse through the url http://localhost/pbireports  on the new Power BI Installation box as shown below.


The next important step is to use the new PowerBIDesktopforRS executable to author the Power BI Reports to publish to this new Power BI Report Server Installation.


Power BI Kids competition 2026

 Celebrating the next generation of data rockstars! 🚀✨ I am incredibly proud to share that we have officially wrapped up our 8-week #PowerB...