Tuesday, January 16, 2018

Did you know that you could export data from different SSRS Tablix into different excel sheets of a workbook?

Today I had a requirement from one of my customer to export data from two different tables generated out of SSRS reports into two different tabs of an excel sheet.
As per my article -- 
Tips to eliminate merged and hidden cells issue when a SSRS reports export to excel. my report has two Tablix with two different data sources. 

These are the steps I followed to export into two different tabs of an excel sheet.
Step 1   Right click on a column in the first Tablix and choose Tablix Properties.
On the General tab there are Page Break options.
Choose the Add Page Break After option as shown below.


Step 2  Next step is to ensure that the header is repeated on the second tab. To achieve this, select the header and choose properties.
Go the RepeatWith Property and choose Tablix2 as shown below.


Now when you export data using Export to Excel – there will be two sheets populated.  The first sheet will contain the first Tablix information and the second sheet will contain the second Tablix information.

Monday, January 15, 2018

Tips to eliminate merged and hidden cells issue when a SSRS reports export to excel.


From the past 3 days I have been working on resolving merged and hidden cells issues when an SSRS reports is exported to excel. 
Here are some tips that you can use to resolve this issue.

To eliminate blank A,B,C  columns at the beginning of the excel file, ensure that the report starts with no space on the left hand side of the report as shown below.


When you have multiple Tablix in your report ensure that they are aligned on both left and right sides of the report as shown below.


When you have title blocks ensure that they are in line with all the Tablix of the report as shown below


Last but not least if you have column groups, then ensure that the report size is same as all the Tablix and titles aligned as shown below.


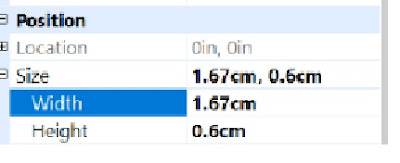
After following all these tips and there are still merged and hidden cells, then ensure that each of the cells/columns in your matrix or Tablix are formatted with width rounded off to either no decimals or 2 decimals as shown below.


Hope you will get rid of the merged and hidden cells problem a lot quicker than the time I spent resolving this issue.


Thursday, January 11, 2018

How to disconnect visuals (bar charts, matrix etc) from Filters/Slicers in Power BI


Today I had a requirement to make a visual (bar graph) disconnected from a filter.  I had a bar graph displaying based on billing month.  The title of the chart is Count in the last 18 months.

If you have a billing month filter, then what happens is this chart will show only 1 month instead of the last 18 months as below.


So in order to show all the 18 months, you need to disconnect this visual from the filters.  To do this, you need to follow the below steps.


Step 1 Go to Edit Interactions button from the Format menu as shown below.


Step 2 Once the Edit Interactions button is highlighted, you can see extra icons for filter and none in the visuals when you hover over the top of the visual as shown below.  By default the filter icon is highlighted.


Step 3  To disconnect the visual from the filters click on the none icon as shown below.  This will not change the behavior of the visual based on the filter selected.


By doing this even if  we change the filter value for Billing Month, the visual displays all the 18 months.


Thursday, January 04, 2018

Connect to your Power BI Desktop Model using SSMS

Did you know that you can connect to your Power BI Desktop Model from Sql Server Management Studio (SSMS)?

If not, this blog post is for you.

In this blog post I will be showing you how to connect to your Power BI Model that you have opened with Power BI Desktop from SSMS.

Whenever I try to Get Data in Power BI, I always closely monitor the Task Manager for Memory usage.
I always notice that there is the Microsoft Sql Server Analysis /services and Power Bi Desktop applications top the memory usage as shown below.


What this means is Power BI Desktop uses Sql Server Analysis Services for getting data into its memory. Even though your local system does not have SSAS installed, it uses the msmdsrv executable that’s in the bin folder of the Power BI Desktop folder as shown below:


So there is a close connection between Power BI Desktop and SSAS.

Now coming to the actual content of this blogpost – In order to connect to the Power BI Desktop model from SSMs, you need to know the exact port that the local instance of SSAS is running.  To find out this port, follow the below steps –
Step 1   Open the Power BI Desktop model you are trying to access from SSMS using the Power BI Desktop application (October 2017). I used the Power BI Desktop application optimized for Power BI Report Server.

Step 2   Now browse to the Local App data folder using the path below –

C:\Users\username\AppData\Local\Microsoft\Power BI Desktop SSRS\AnalysisServicesWorkspaces\AnalysisServicesWorkspace422556974\Data

If you are using the regular Power BI Desktop model the local appdata folder will be as below
C:\Users\username\AppData\Local\Microsoft\Power BI Desktop\AnalysisServicesWorkspaces\AnalysisServicesWorkspace422556974\Data

Step 3.  In the above folder locate a text file named msmdsrv.port.txt as shown below :


Step 4  Open the file and copy the number of the port that is displayed.

Step 5  Now open SSMS and connect to Analysis services by giving localhost:portnumber  as shown below :


It uses Windows Authentication to connect to the model.

Step 6  Now you can see the databases and associated tables in the model as shown below.


There you go ... You are now connected to your Power BI Model using SSMS.


Free Power BI Classes for Week 7 (Last)

Just completed the last class of the F ree  P ower BI  classes of this series.  Today we have covered Adding a canvas background Adding Imag...